
Creating a Custom Map Tile
R leaflet · maps · R · mapbox
In my DataCamp course on making interactive web maps in R using leaflet, I covered how to change the map tile using the addProviderTiles function. This allows us to use the more than 100 map tiles included with the leaflet package. For example, we can create a map using the Esri provider tile.
However, there may come a time when we need to customize a map beyond using these provider tiles so that it fits with a particular project or website. One way to accomplish this is to use Mapbox. What follows is a quick overview that demostrates how to access and build custom maptiles in R, for more information see the Mapbox tutorials.
Once we create an account on Mapbox, we will have access to their design studio that enables point-and-click editting of map layers, colors, icons, fonts, etc. Currently, Mapbox provides 50,000 map views a month for free (see pricing).
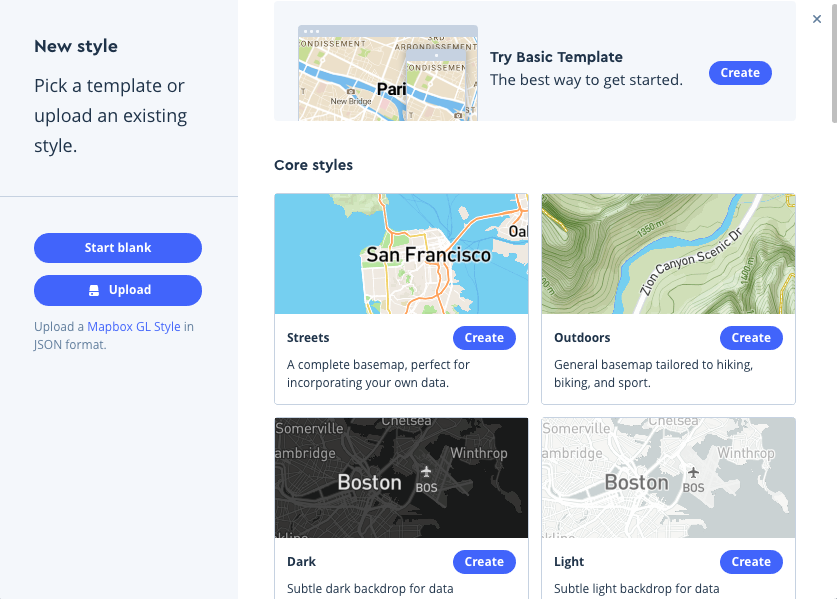
In the design studio we can start with the basic template or select one of the core styles that may approximate the look that we are going for.
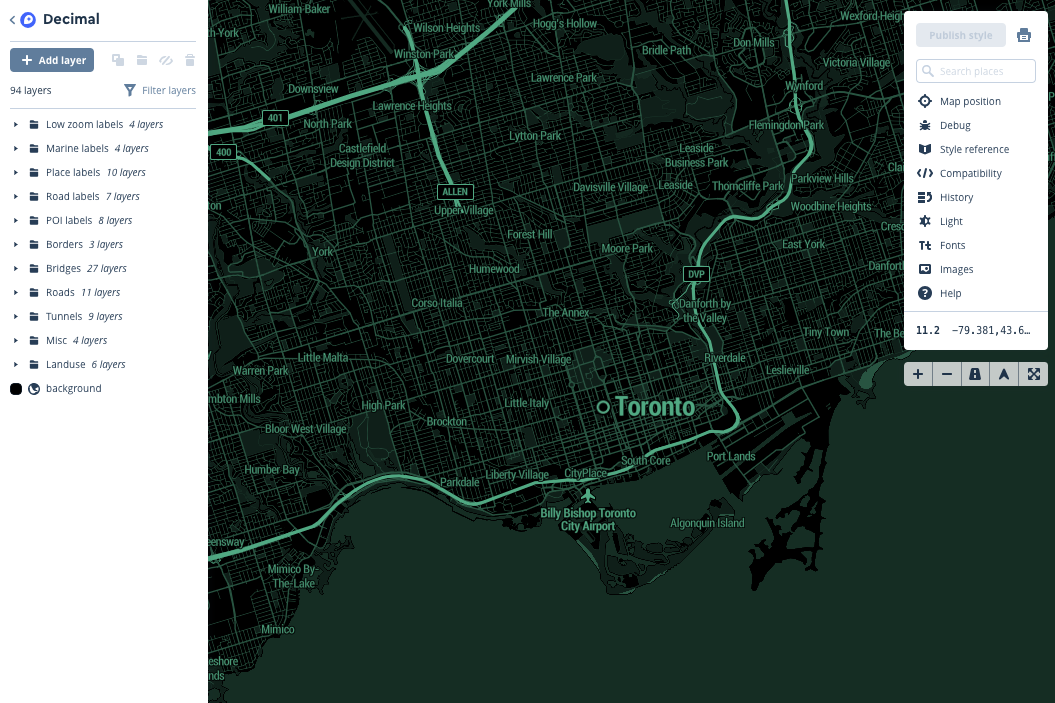
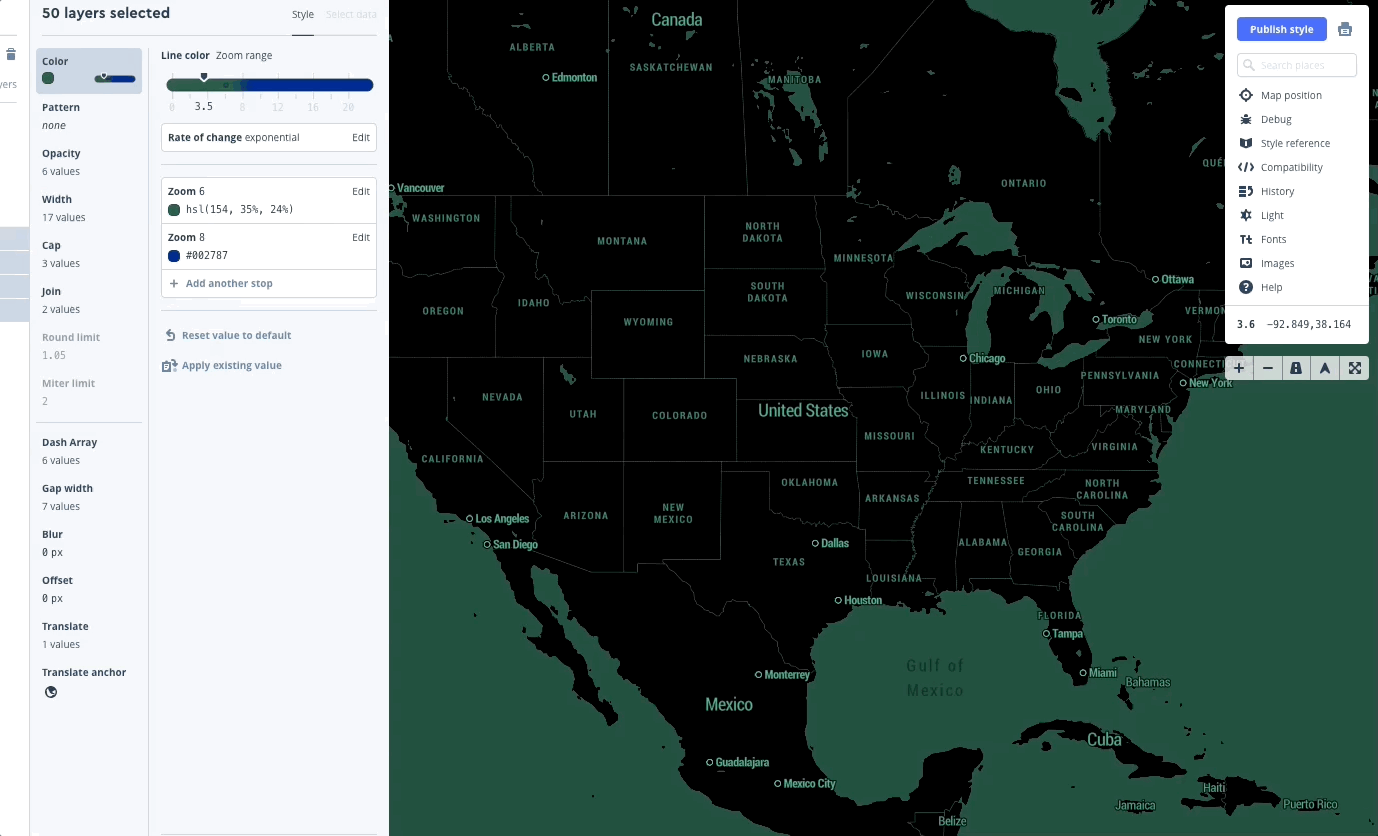
For this example, I’ll be working with the Decimal map template. Once we select a map style the editor will open and we will see the map, the map layers presented in the left-hand sidebar, and some additional functionality presented in the upper-right corner menu (e.g., adding images, fonts, etc.).
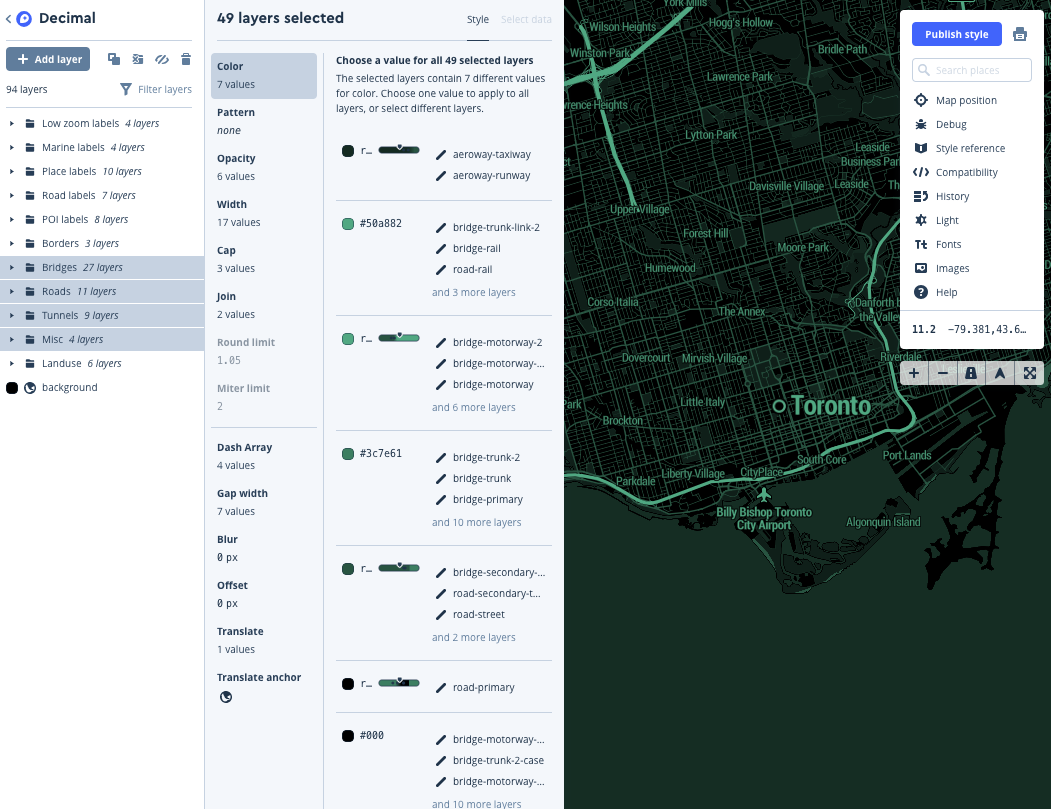
We can edit the layers individually or we can edit the several layers of the same type at the same time by selecting multiple layers while holding shift.
For example, we could change the color of the lines from green to blue (i.e., #002787).
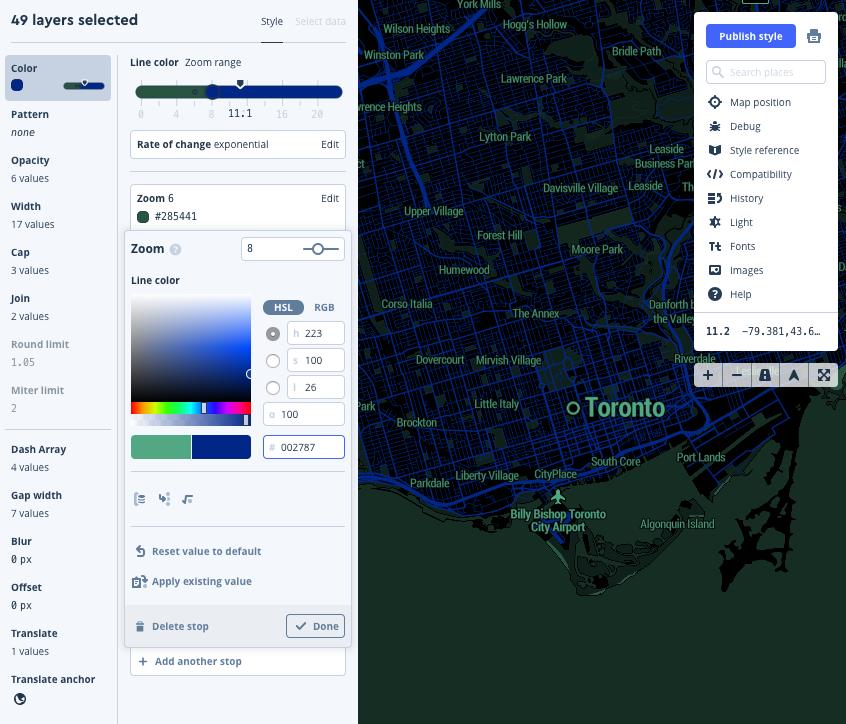
We can also include stops at different zoom levels so that the colors of certain layers of our map transition as we zoom.
Once we have our map styled, we can use it from R by clicking publish in the upper-right corner menu.
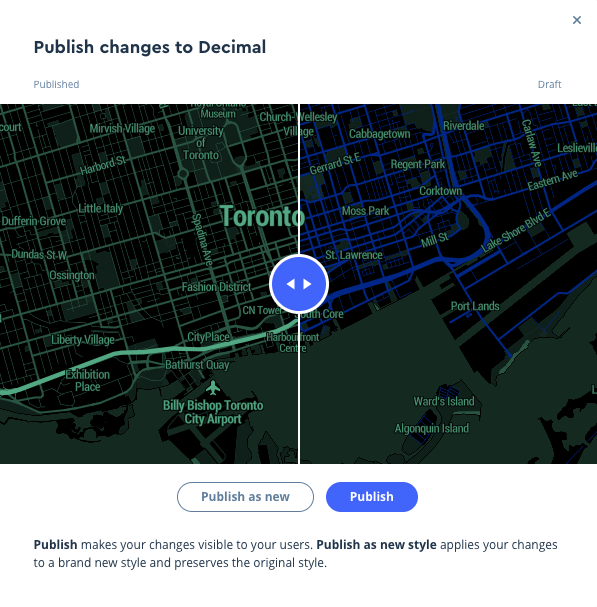
After we publish our map, we can click share and scroll to the “Develop with this Style box”. Then switch the slider from Mapbox to leaflet and copy the link. We can access our new map from R using the urlTemplate argument of the addTiles function. Zoom in to check out those blue lines!
Then we can add markers or other features using the functions from the leaflet package.
Give it a try and let me know what you create!